Two clean lenses, no double counting: (A) direct cash transfers into WC public bodies; (B) nationally delivered services that happen in the Western Cape. A short “Lens C” notes SOE activity (off-budget).
Baseline
Taxes generated in the Western Cape (2025/26, Method B): R312 billion (Econometrix, 2025). The question is how much of this is spent in the WC directly or via national functions.
Lens A — Direct cash transfers into WC public entities (2025/26)
These are funds that flow from the national fiscus to the Western Cape Government (WCG) and to the City of Cape Town (CoCT). The lens is kept narrow to avoid double counting with Lens B.
| Component | R bn | Notes |
|---|---|---|
| WCG — Provincial Equitable Share | 65.376 | National ➜ Province |
| WCG — Conditional Grants (total) | 16.268 | National ➜ Province (ring-fenced) |
| CoCT — Municipal Equitable Share | 4.694 | National ➜ Municipality (operating) |
| CoCT — General Fuel Levy (assigned) | 2.852 | National assigned revenue |
| CoCT — National capital grants (USDG, PTNG-BFI, INEP, NDPG, MIG) | 3.736 | National share of CoCT capex grants |
| Subtotal: identifiable direct transfers | 92.9 | Excludes other WC municipalities (conservative) |
Not counted here (to avoid double counting): WCG own receipts (~R3.9bn, e.g., motor-vehicle licences, gambling/liquor) and provincial pass-throughs to municipalities (~R3.3bn) — these sit inside the WCG envelope above.
Lens B — Nationally delivered services that happen in the WC (indicative, 2025/26)
These are services executed by national departments and entities within the WC (no provincial/metro grants included). Selected national totals are apportioned by the WC share of population (~12%) to show an indicative amount happening in-province.
| National function / vote (examples) | SA total 2025/26 (R bn) | WC @ ~12% (R bn) | Notes (kept “nationally executed”) |
|---|---|---|---|
| Peace & Security (SAPS, Justice/Correctional Services, Defence) | 267.6 | ≈32.1 | Nationally delivered policing, courts, prisons, defence footprint |
| Economic Regulation & Infrastructure (transport/logistics regulators & networks) | 175.7 | ≈21.1 | DoT/SANRAL/PRASA/regulators; excludes metro/provincial grants in Lens A |
| Post-school Education & Training (universities, TVET, NSFAS) | 146.6 | ≈17.6 | National system; strong WC campus footprint (UCT, SU, CPUT) |
| Social Protection (cash grants paid to WC beneficiaries) | 327.5 | ≈39.3 | SASSA grants administered nationally; received in the WC |
| General Public Services (excl. debt-service costs) | 78.7 | ≈9.4 | Parliament, SARS operations, DPWI accommodation/EPWP, etc. |
| Home Affairs (immigration & civic services) | 15.4 | ≈1.9 | Ports of entry, visas/asylum, IDs/passports — delivered in the WC |
| Indicative total nationally delivered in WC | — | ≈121.4 | Upper-bound estimate |
Note: To avoid double counting, Lens B excludes provincial and municipal grants (already in Lens A). The transport line may slightly overstate WC activity because a portion of national transport allocations includes metro/provincial grants; subtracting the WC grants recorded in Lens A lowers Lens B by roughly R2–3bn.
Putting it together (no double counting)
- Lens A (direct transfers): ≈ R92.9bn
- Lens B (nationally delivered in WC): ≈ R121.4bn (≈R118bn after strict transport-grant deduction)
Combined “spent in the WC” (A + B): ≈ R214.3bn (upper-bound). Against R312bn raised, that implies ≈R97.7bn not spent in the WC (≈31% of taxes). A stricter view (deducting the transport overlap) places the gap just above R100bn.
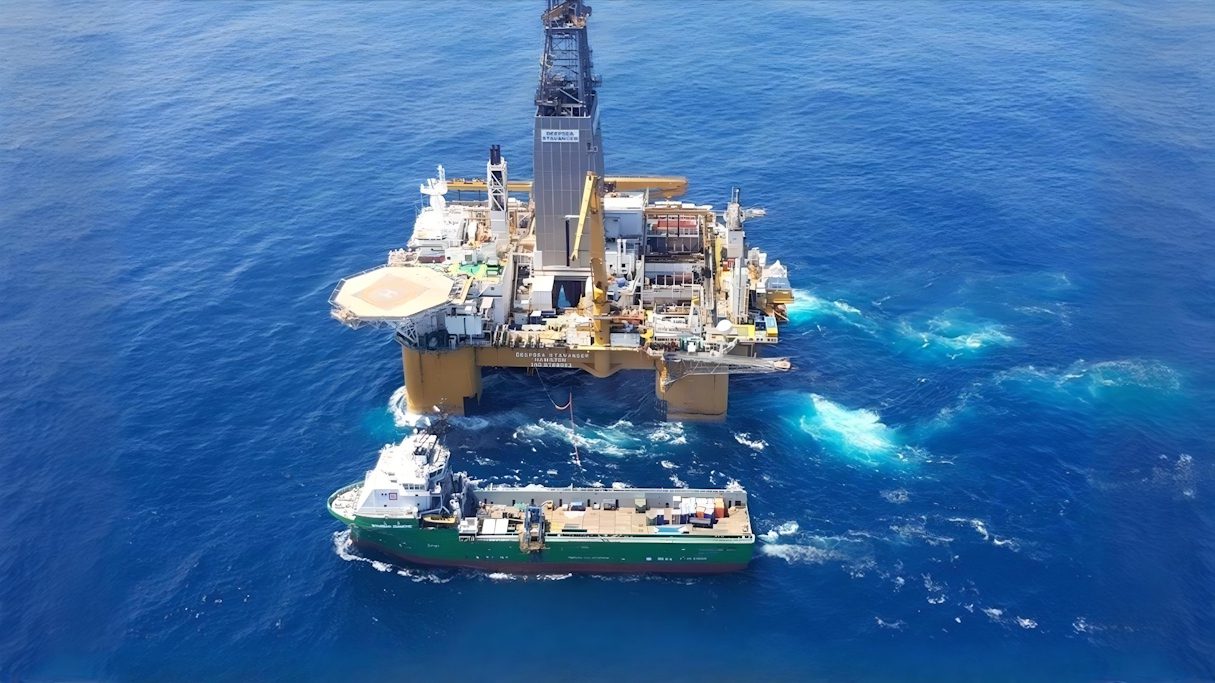
Lens C — SOE footprint (off-budget, for context)
Ports, freight rail and airports largely sit on SOE balance sheets (Transnet/PRASA/ACSA) rather than the voted budget. These activities materially affect the WC economy and are funded through SOE revenues, borrowings and occasional national injections. These amounts are not added to either Lens A or Lens B to keep totals single-counted.
Method
- Lens A totals are taken from the Western Cape and CoCT 2025/26 budgets and the Division of Revenue (provincial equitable share + conditional grants; CoCT equitable share, GFL and national capex grants).
- Lens B uses the National Treasury 2025 Budget Review (Table 5.4): selected nationally executed functions are apportioned by the WC population share (~12%). Provincial/metro grant flows are excluded to avoid overlap with Lens A.
- Health & Basic Education: national departmental operations are relatively small compared with provincial flows already captured in Lens A; therefore they are not added separately in Lens B.
Dr. Joan Swart has a PsyD Forensic Psychology, an MBA and a Masters in Military Studies. She is a director of CapeXit NPO.

The sooner this happens the sooner we’ll be able to govern and sustain ourselves sensibly. And the sooner we can become an international viability and attract investment.