How big the province’s economy is, how it grows, which sectors matter, where it stands globally, and what that could mean for independence.
The Western Cape is one of South Africa’s most dynamic provincial economies. In 2023 it accounted for about 13.8% of national GDP, placing it third after Gauteng and KwaZulu-Natal. New estimates for 2024 put the province at roughly 14.3% of South Africa’s total output, with real GDPR around R666.8 billion.[1][2] Cape Town alone generates roughly 70%+ of the Western Cape economy and about ~10% of South Africa’s GDP.[3][4]
Growth: Often Above the National Trend
While South Africa’s national growth has been subdued in recent years, the Western Cape has frequently matched or outpaced it on multi-year horizons. Between 2014 and 2024, the province’s economy expanded by 8.7% in real terms, ahead of Gauteng (7.7%) and KwaZulu-Natal (7.5%).[2] Quarterly cycles still bite (e.g., 2024Q3 contraction), but the medium-term picture points to resilience and comparatively stronger momentum.[5]
What the Economy Is Made Of
The Western Cape is predominantly a services and manufacturing economy. Finance, real estate and business services comprise the single largest slice, with manufacturing, trade/tourism, transport and government services also significant. Agriculture is smaller in share but globally competitive (wine, fruit, horticulture) and highly export-oriented.

Sidebar: A Services-Driven Economy
Almost a third of provincial GDP comes from finance, real estate and business services. Manufacturing and trade/tourism add depth, while agriculture, though smaller, punches above its weight through high-value exports. A services-heavy mix supports productivity and global linkages.
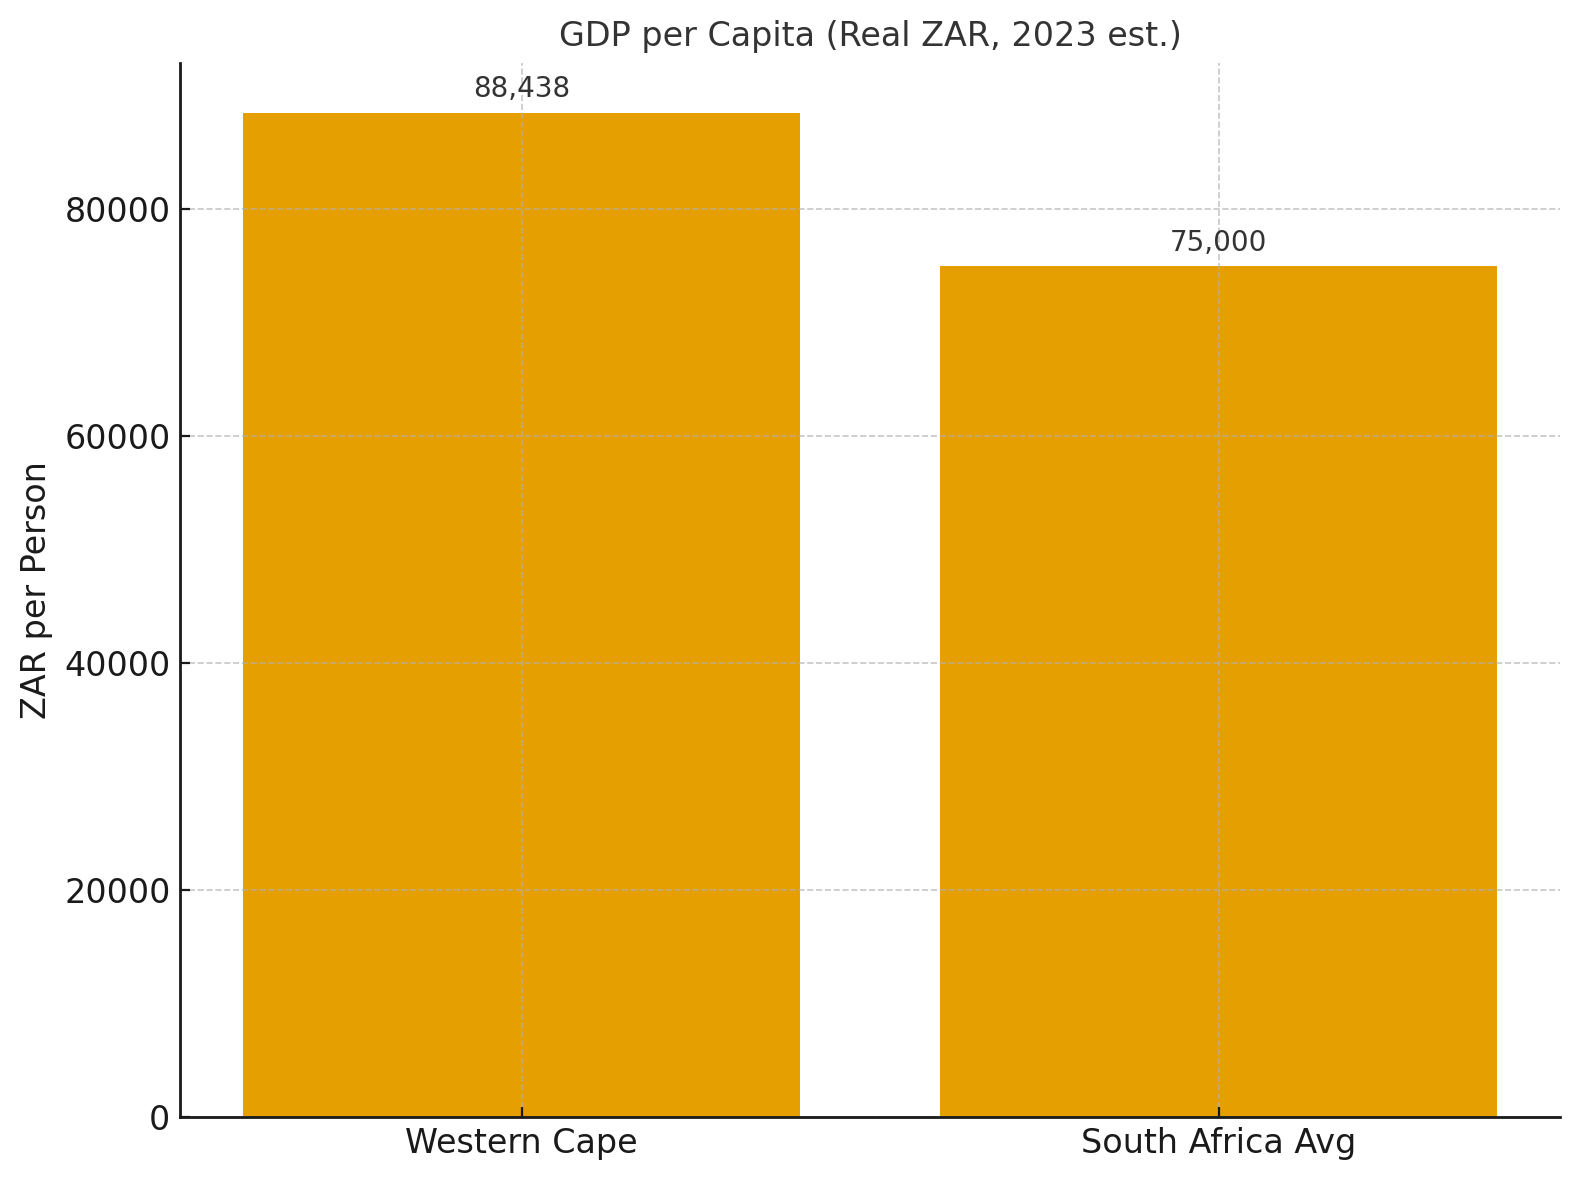
Output per Person: Higher Than the SA Average
On a per-capita basis, the Western Cape consistently sits above the national mean. Wesgro’s 2023 estimates put real GDP per capita at about R89,620 versus South Africa’s R74,631 (real).[1] This gap reflects higher productivity, deeper services, and relatively stronger governance.
Sidebar: Richer Base
A higher GDP per capita means more fiscal space per resident to invest in infrastructure, human capital and safety—key ingredients for long-run growth.
The Province’s National Weight
Despite hosting roughly 12% of South Africa’s population, the Western Cape delivers ~14% of national GDP—an outsized contribution that underscores its importance to the national economy and its potential agency in shaping its own development path.[2][6]

Sidebar: Cape Town’s Role
Cape Town accounts for 70%+ of Western Cape output and close to 10% of South Africa’s GDP—illustrating the province’s concentration of high-value services, trade and manufacturing.[3][4]
Global Benchmarks: Total and Per-Capita
Internationally, an economy of ±R650–R700 billion (real) with a per-capita level above the South African average would place the Western Cape in the upper-middle-income bracket by many metrics, comparable (in size) to smaller countries and (in income) to the mid-tier of emerging markets. Exact rankings depend on exchange rates and PPP adjustments, but the structure—services-heavy, export-oriented niches, and tourism—resembles competitive small economies that leverage openness and strong institutions.[1][2]
Independence Implications: Strengths to Leverage, Gaps to Close
Strengths
- Service & manufacturing backbone: Deep business services, tech-enabled trade, and specialised manufacturing integrate well with global value chains.
- Above-average output per person: A stronger tax base and better service delivery track record provide a platform for investment and reform.
- Exportable agriculture & tourism: Wine, fruit and horticulture value-chains, plus a world-class tourism brand, support foreign-exchange earnings.
- Institutional reputation: Comparative governance advantages are a magnet for skills and capital.
Needs & Risks
- Trade architecture: A small open economy must lock in market access (SACU/SADC/EU/UK/US), rules-of-origin clarity, and smooth borders; supply chains and services exports rely on it.
- Scale & connectivity: Maintain cooperation for large-scale energy, logistics, and standards; port, power and digital infrastructure are binding constraints that require investment.
- Macro framework: Currency choice, central-bank credibility, debt anchors and inflation control would be decisive for confidence.
- Transition costs: Asset/liability splits, pensions, and inter-governmental service arrangements require careful, negotiated pathways.
Bottom line: Independence is not a magic wand—but the Western Cape’s economic profile suggests a credible platform if openness, infrastructure, and institutional quality are protected and scaled.
Sources
- Wesgro, Economic Overview of the Western Cape, 2023 Q4 (12 Apr 2024). PDF.
- Western Cape Government (Dept. of Agriculture), “Western Cape Leads Provincial Economic Growth – Stats SA GDP report” (2025). Link.
- ICLEI, “Cape Town, South Africa” city profile. Link.
- City of Cape Town / Invest Cape Town EPIC report & economy pages. EPIC Q3 2024 | Economy page.
- Stats SA, Provincial gross domestic product (P0441.2, 2023–2024). 2024 PDF.
- TIPS, Provincial Review 2024: Western Cape. PDF.
Dr. Joan Swart has a PsyD Forensic Psychology, an MBA and a Masters in Military Studies. She is a director of CapeXit NPO.